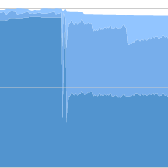
At Findery, we had an issue where image manipulation was failing when we ran out of memory (“Cannot allocate memory – convert”) on our web instances. In some cases, we couldn’t even run our Chef deploy in Opsworks because the servers were so out of memory. Every 2 or 3 days, we would see gradual increases in our memory graphs below until the instance was practically out of memory. The only solution would be to restart unicorn. You can see the instance running out of memory below. These are sometimes called sharks because the graph resembles a shark fin. It’s important to note that theses are not memory leaks per se, but memory bloat where the Ruby interpreter MRI doesn’t return memory to the OS. I tried everything. Different versions of Ruby didn’t help. Puma, Unicorn, and Passenger all had the same problem. Unfortunately, even calling GC.start to run garbage collection explicitly didn’t resolve these issues.
Incidentally, I also had this problem with long-lived Sidekiq workers at Heroku. Even the 14GB dyno at Heroku would eventually max out. MRI would gladly gobble all of the available memory. I found the following answers from Mike Perham in a Github issue at Sidekiq.
Memory bloat is something many Rails applications suffer from. We at The Clymb have a serious case of bloat in our pumas and sidekiqs too. Our workaround: have monit monitor the amount of memory consumed and restart the process if it reaches a certain threshold.
After much research, I came away with a solution that just doesn’t seem right. Ruby servers need to be restarted every once in a while. However, I found the same response in multiple blogs and Stack Overflow answer. There are multiple ways to do this automatically.
- Use Monit or God to monitor the processes and restart
- Use a gem such as unicorn-worker-killer or puma-worker-killer to restart the processes
- Use Unicorn Out of Band Garbage Collection
- In the case of Heroku Resque or Sidekiq workers, use the heroku-api gem to periodically restart
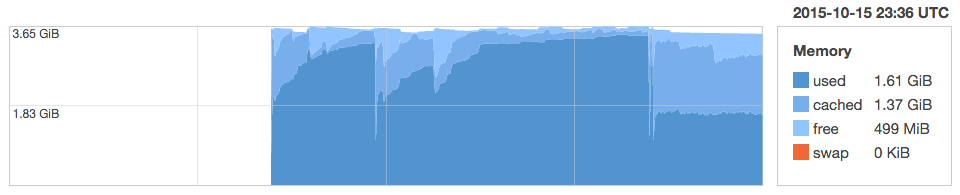
In the end, I used unicorn-worker-killer for unicorn and regular Sidekiq restarts with the heroku-api gem. I’m happy with the results. You can see in the Findery graph above where used memory plateaus at under 2GB compared to nearly 4GB before. My Sidekiq workers were able to run on the 2GB dyno as expected instead of the 14GB dyno.
The real solution is to memory bloat is to profile and optimize. In my case, I think the problem is an overdependence on ActiveRecord and the nokogiri gem. However, using one of the methods above or a combination may buy you time to do this optimization.
Resources:
https://www.omniref.com/blog/blog/2014/03/27/ruby-garbage-collection-still-not-ready-for-production/
https://blog.engineyard.com/2009/thats-not-a-memory-leak-its-bloat/